Introduction
rsRNAbase is a web server for analyzing the rsRNA sequencing expression data of 2900 samples from the GEO, using a standard processing pipeline.
Quick start
The main functions provided by rsRNAbase are displayed on the homepage. Users can select the corresponding content by clicking the corresponding button,
and then click the “GO” to jump to the corresponding page.
General Search
This function allows users to obtain the sequence information of rsRNA by setting selection conditions, which include the type and subunit type of rsRNA source
rRNA, the SRR number and source type of the sample, or directly search for rsRNA of a certain name.
Target Search
This function allows users to search for the target gene corresponding to rsRNA.
The corresponding rsRNA can also be searched by the target gene.
Length Distribution
This function counts the length distribution of rsRNA from different rRNA sources.
Because it is an overall feature analysis, no input parameters are required. The
results are shown below as a box plot, and the image will be updated as the sample is updated.
Spatial Distribution
Users can select different rDNA regions and observe the positional distribution of aligned rsRNA.
The results are displayed in the form of a heatmap below.
Tissue Specificity
Detect the specific expression of rsRNA in normal tissues. The details are as follows.
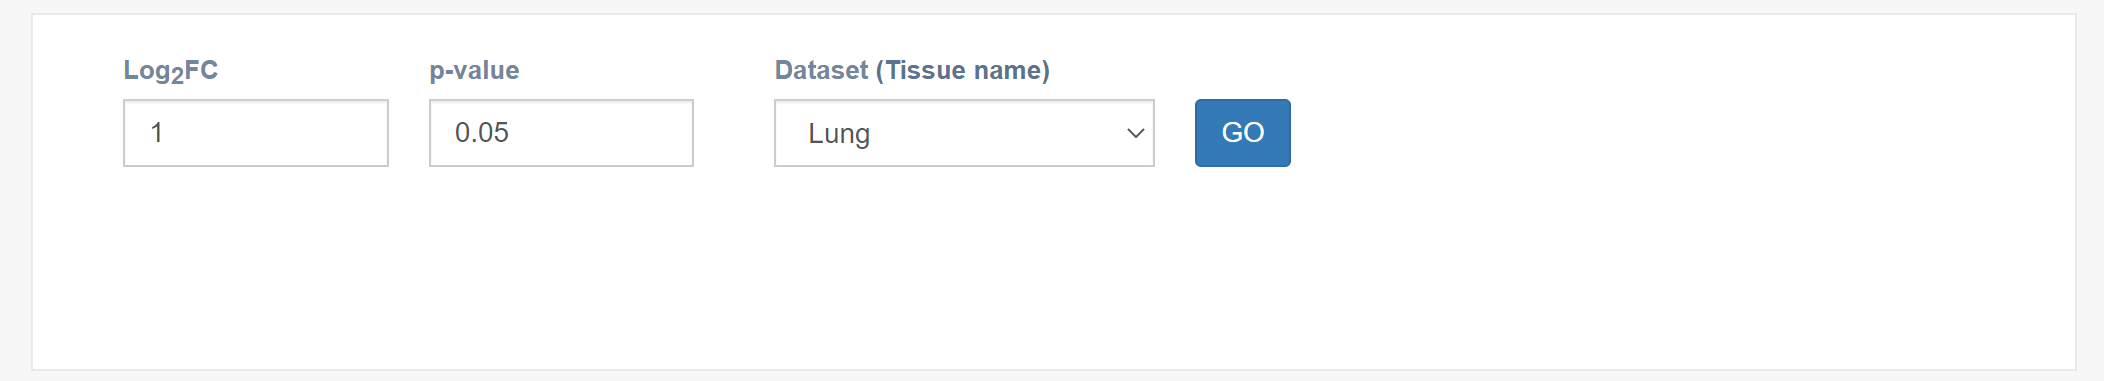
Parameters
log2FC : Set custom fold-change threshold (absolute value).
p-value Cutoff: Set custom p-value threshold.
Tissue name: Select the tissue type of interest.
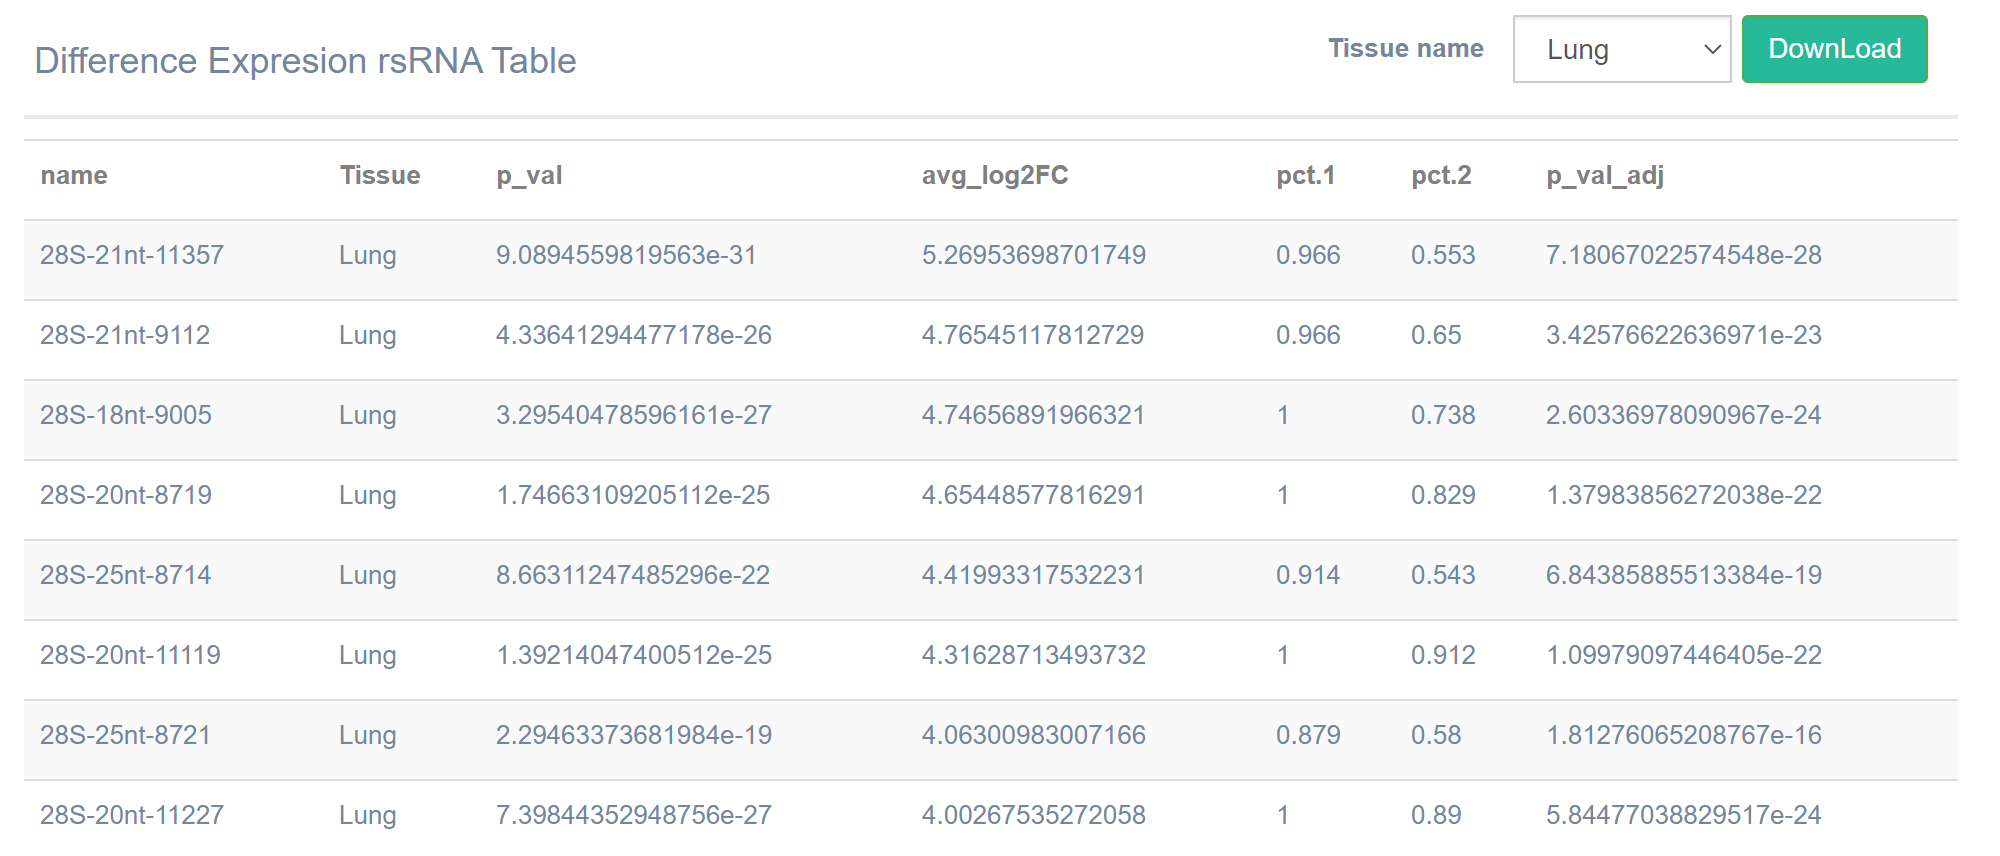
Results
After inputting the parameters, the result graph and the list of marker rsRNA
of the selected tissue will be generated according to the input parameters [by
default, the list sorted in descending order of log2FC]. Click the "DownLoad" button
to download the list locally.

rsRNA Cancer
Calculation of differentially expressed rsRNA
Calculate the differentially expressed rsRNAs in tumor tissues. Details are as follows.
Parameters
log2FC : Set custom fold-change threshold (absolute value).
p-value: Set custom p-value threshold.
Dataset (Tissue name): Select the tissue type of interest.
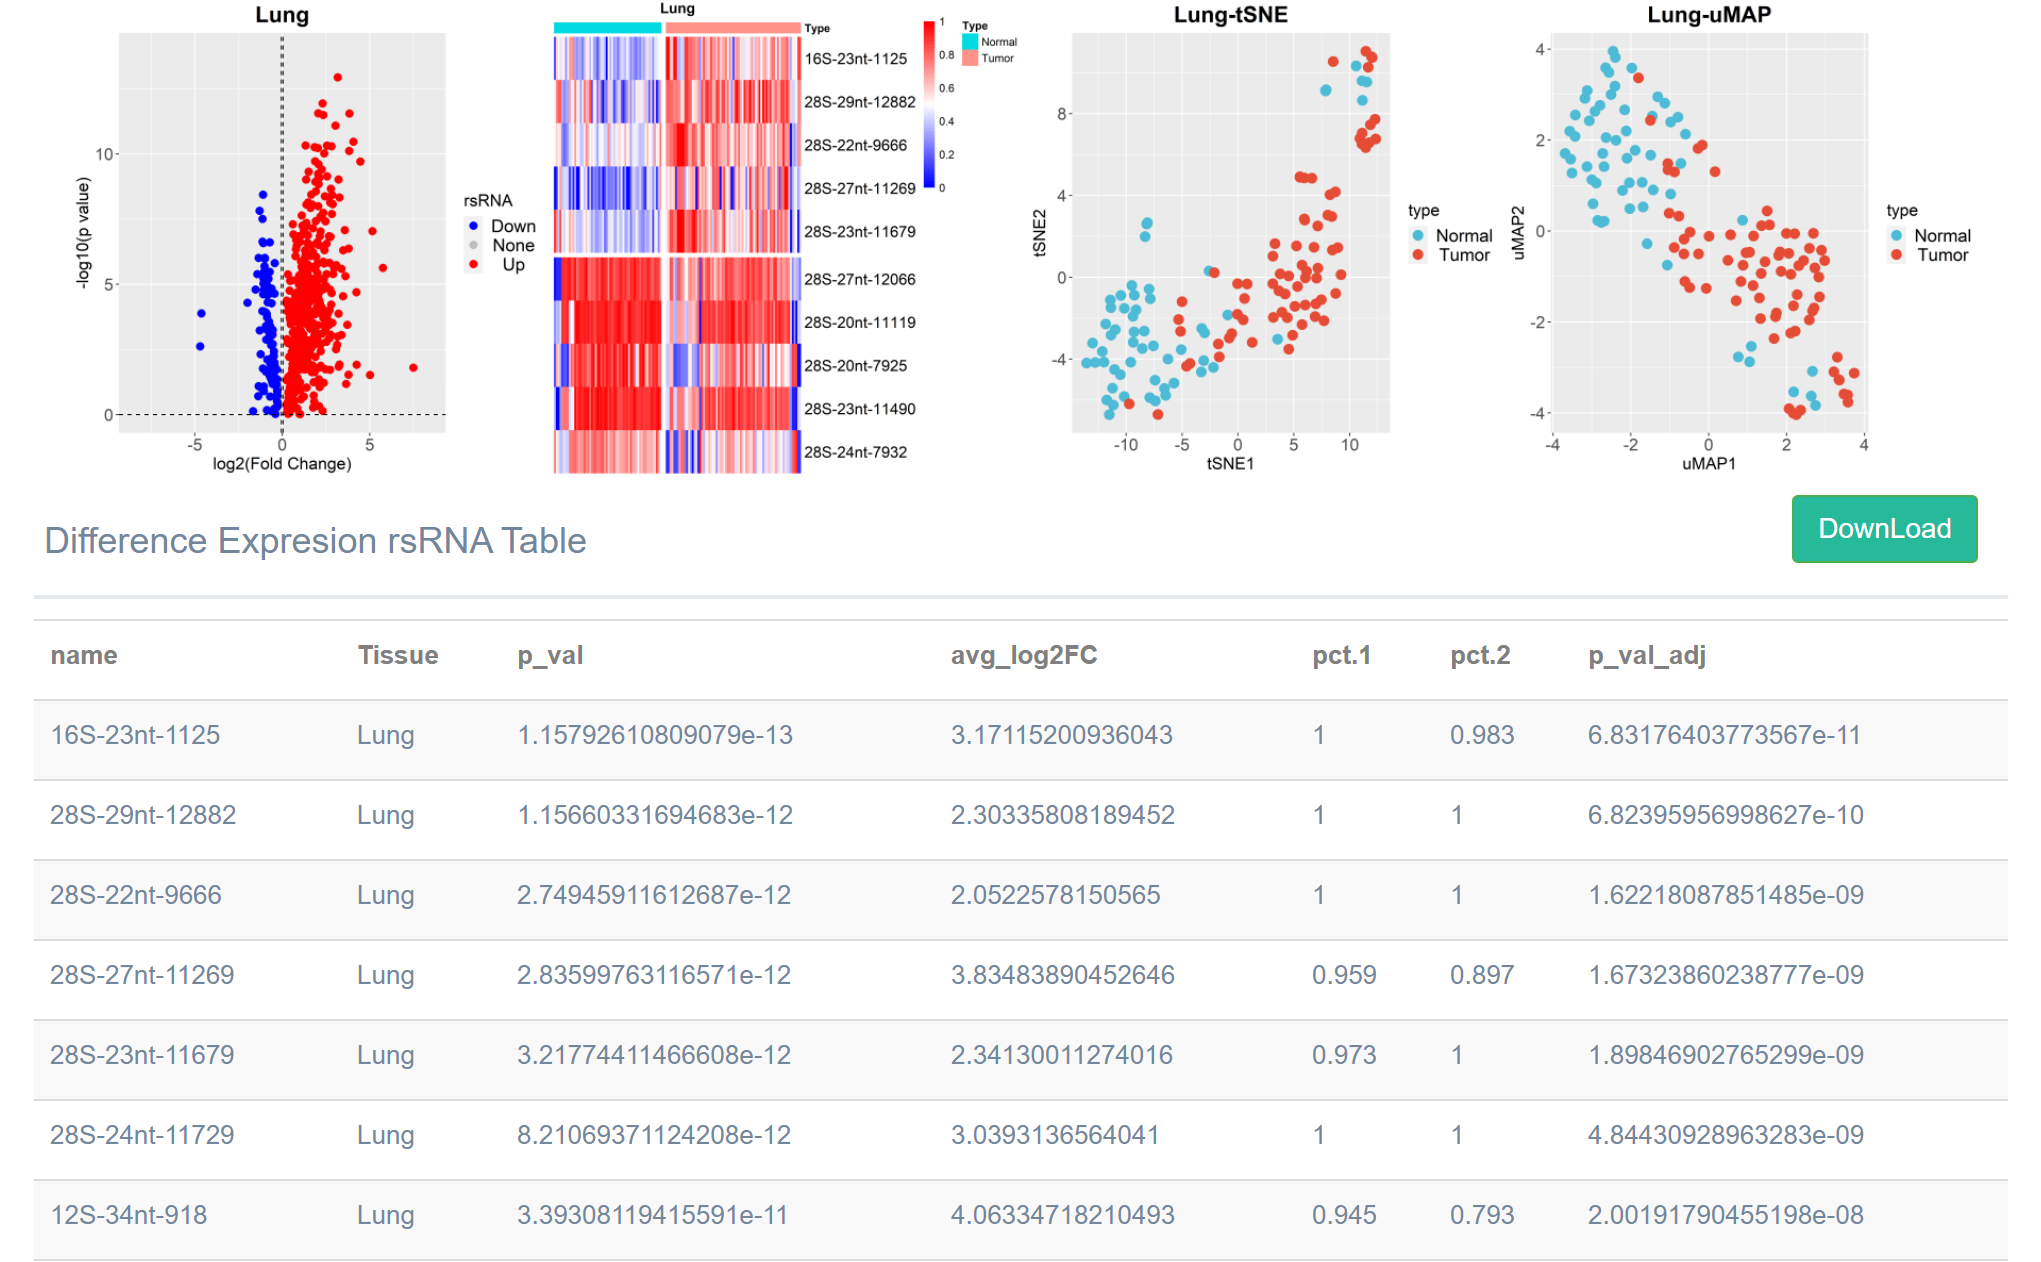
Results
After the parameters are input, the resulting graph and the list of differentially expressed rsRNA of the selected tumor
tissue will be generated according to the input parameters (by default, the list sorted in ascending order of p-value).
Click the "Download" button to download the list locally.
Functional Analysis
Selected tumor tissues and calculated differentially expressed rsRNAs based on the "rsRNA Cancer" panel
and performed functional predictions. Details are as follows.
Parameters
p-value: Set custom p-value threshold.
pAdjust: Select the analytical method to perform P-value correction.
Database: Select the database used for functional pathway prediction.
Dataset (Tissue name): Tumor tissue type selected in the “rsRNA Cancer” panel (Disable selection).
Results
After entering the parameters, the functional pathway prediction will be performed based on the input parameters
and the differentially expressed rsRNA calculated in the
previous step of the selected tumor tissue, and the results will be displayed in a list (by default, the list
sorted in ascending order of p-value). Click the "Download" button to download the list locally.
Hope you enjoy rsRNAbase!